See which posts beat your usual

Every post from every account sits in one place with the numbers its platform reports, so you can see what is working and do more of it.

LinkedIn
X (Twitter)
Instagram
Threads
YouTube
Bluesky
beehiiv
Ghost
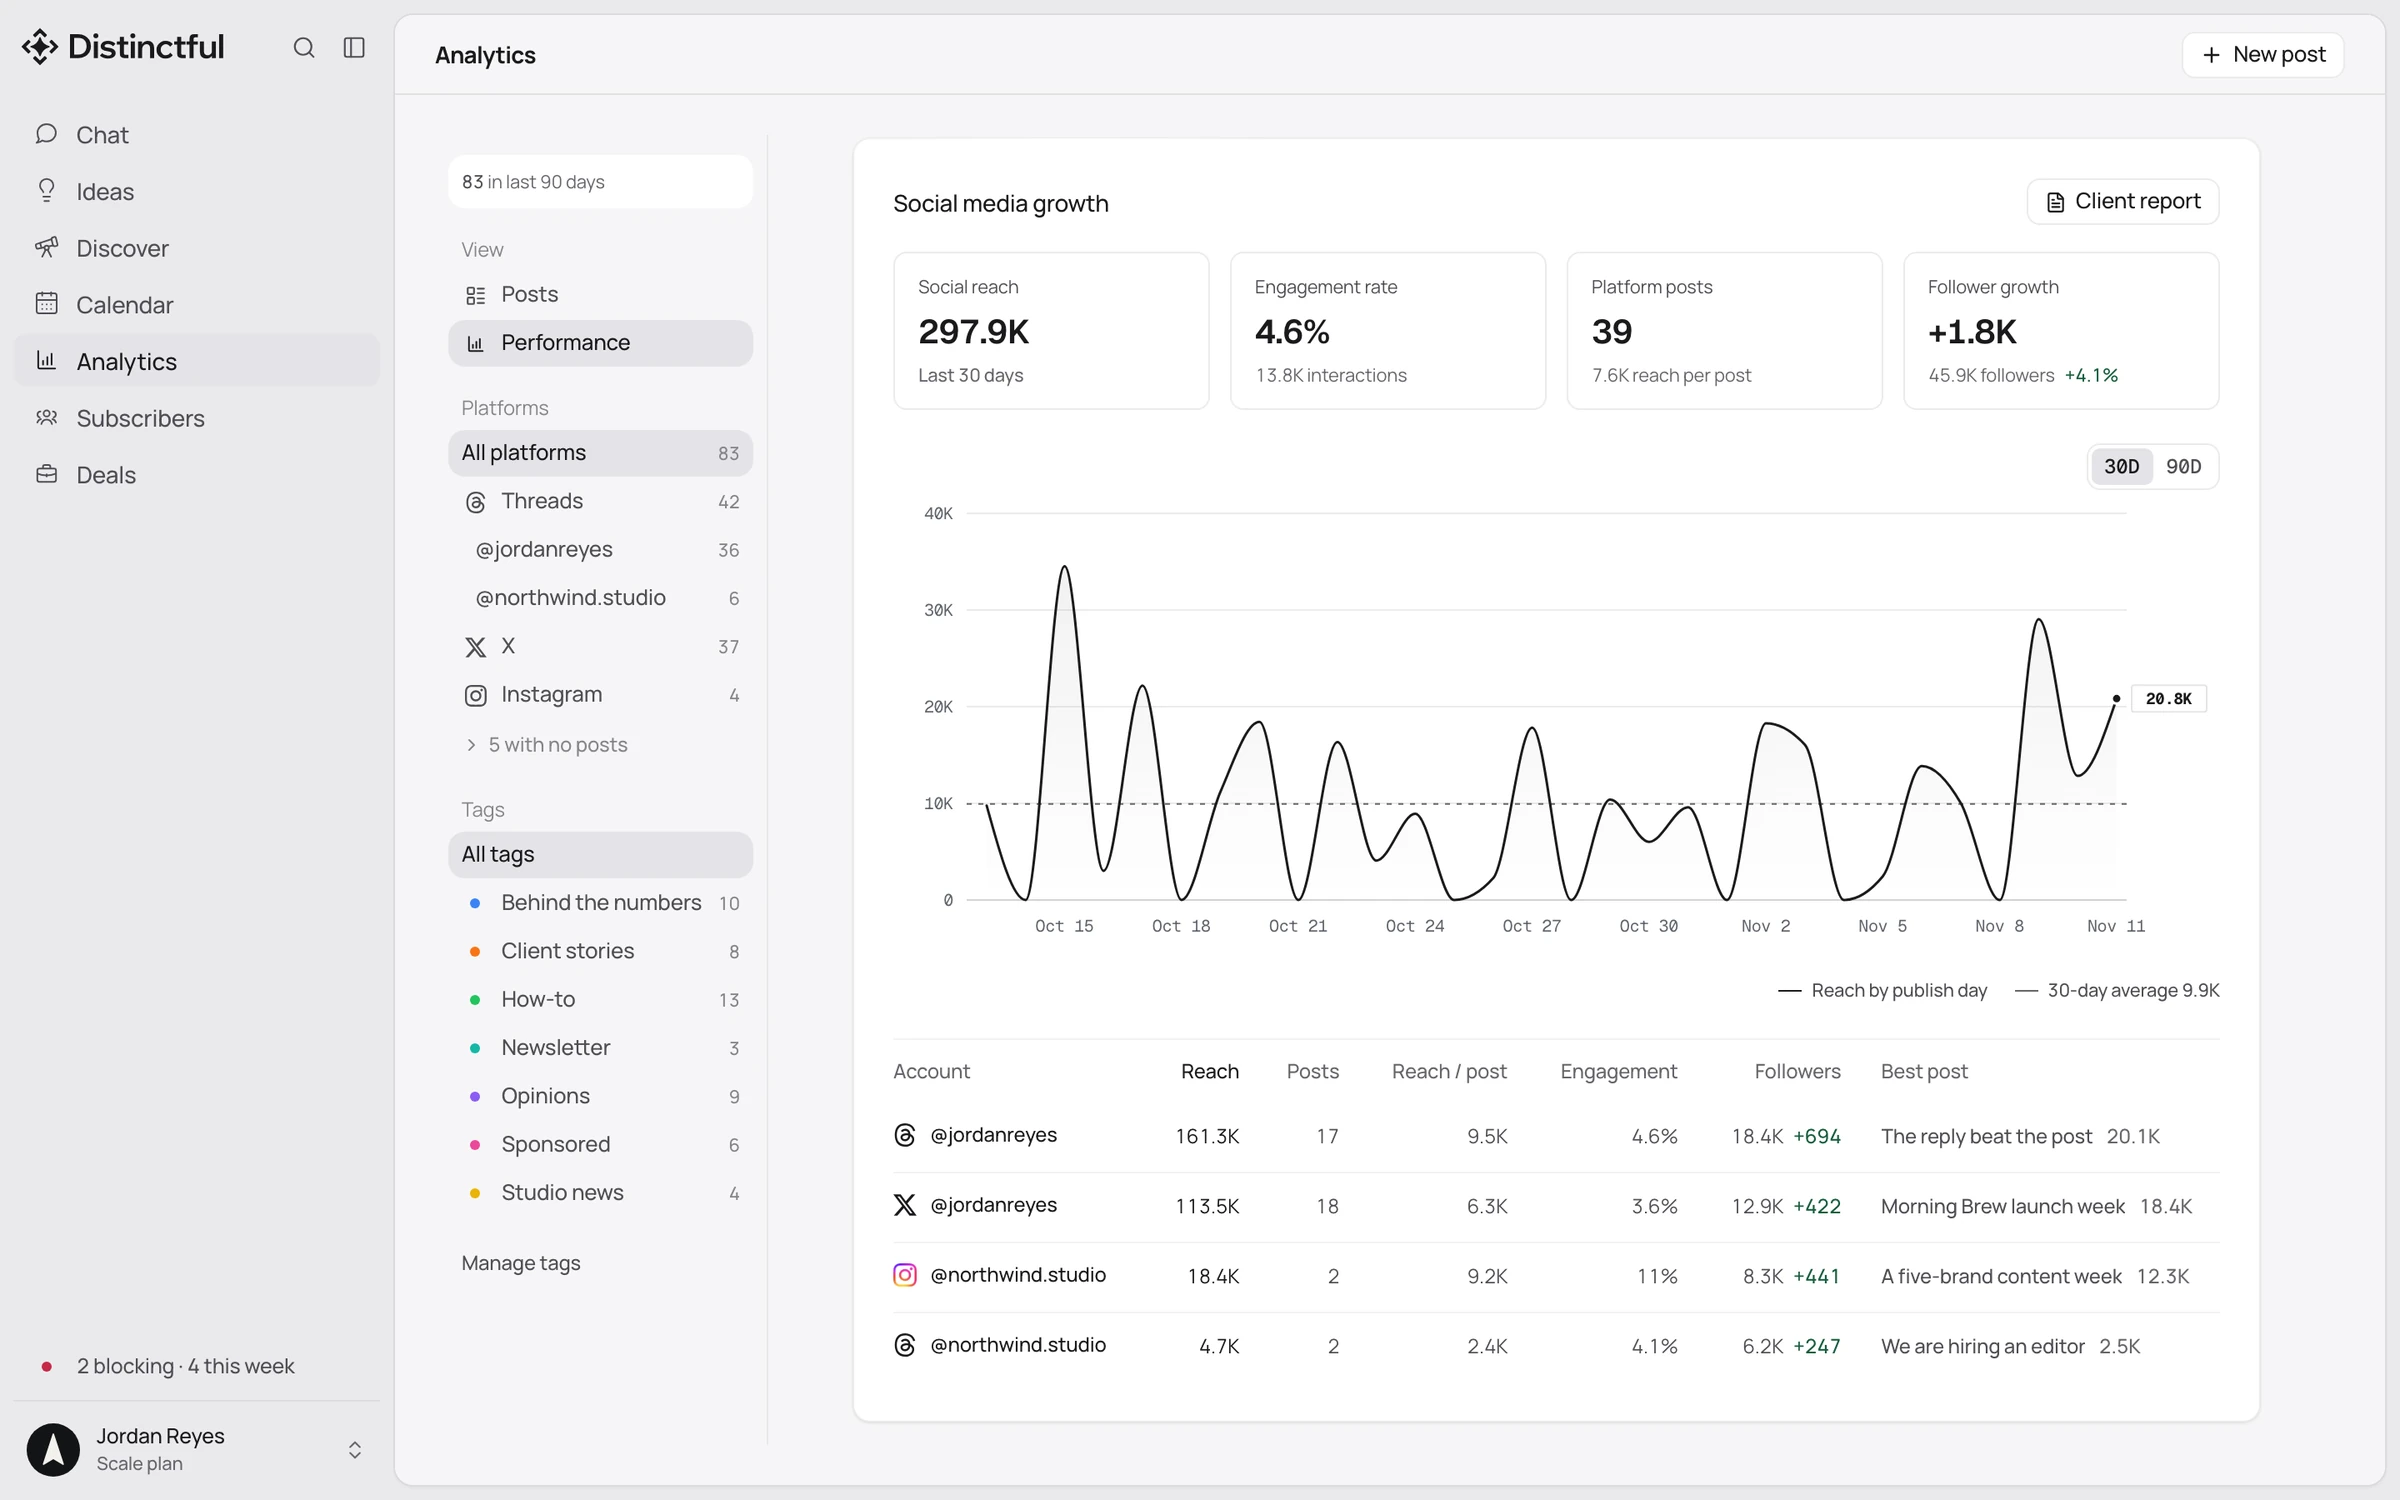
Distinctful Analytics in light mode, Performance view: social reach, engagement rate, posts, and follower growth for the last 30 days, a daily reach chart, and a table comparing four accounts

Without Distinctful

  • Checking each platform’s own analytics, one tab at a time
  • Judging a post by raw likes with nothing to compare it to
  • No way to tell which kind of post is working
  • Screenshots pasted into a report by hand

With Distinctful

  • Every post from every connected account in one list
  • Each post compared with what that account usually gets
  • Tags that show reach and engagement by kind of post
  • A report link with the numbers each platform reported

Every post. Every account.

Distinctful Analytics lists every post you publish and imports per-post numbers from X, Threads, Instagram, and Bluesky as each platform reports them. Filter by platform or account, tag posts by theme to compare reach and engagement, and set your accounts side by side.

Open any post and see its numbers

Each post shows the numbers its platform reports and how its reach compares with what that account usually gets.
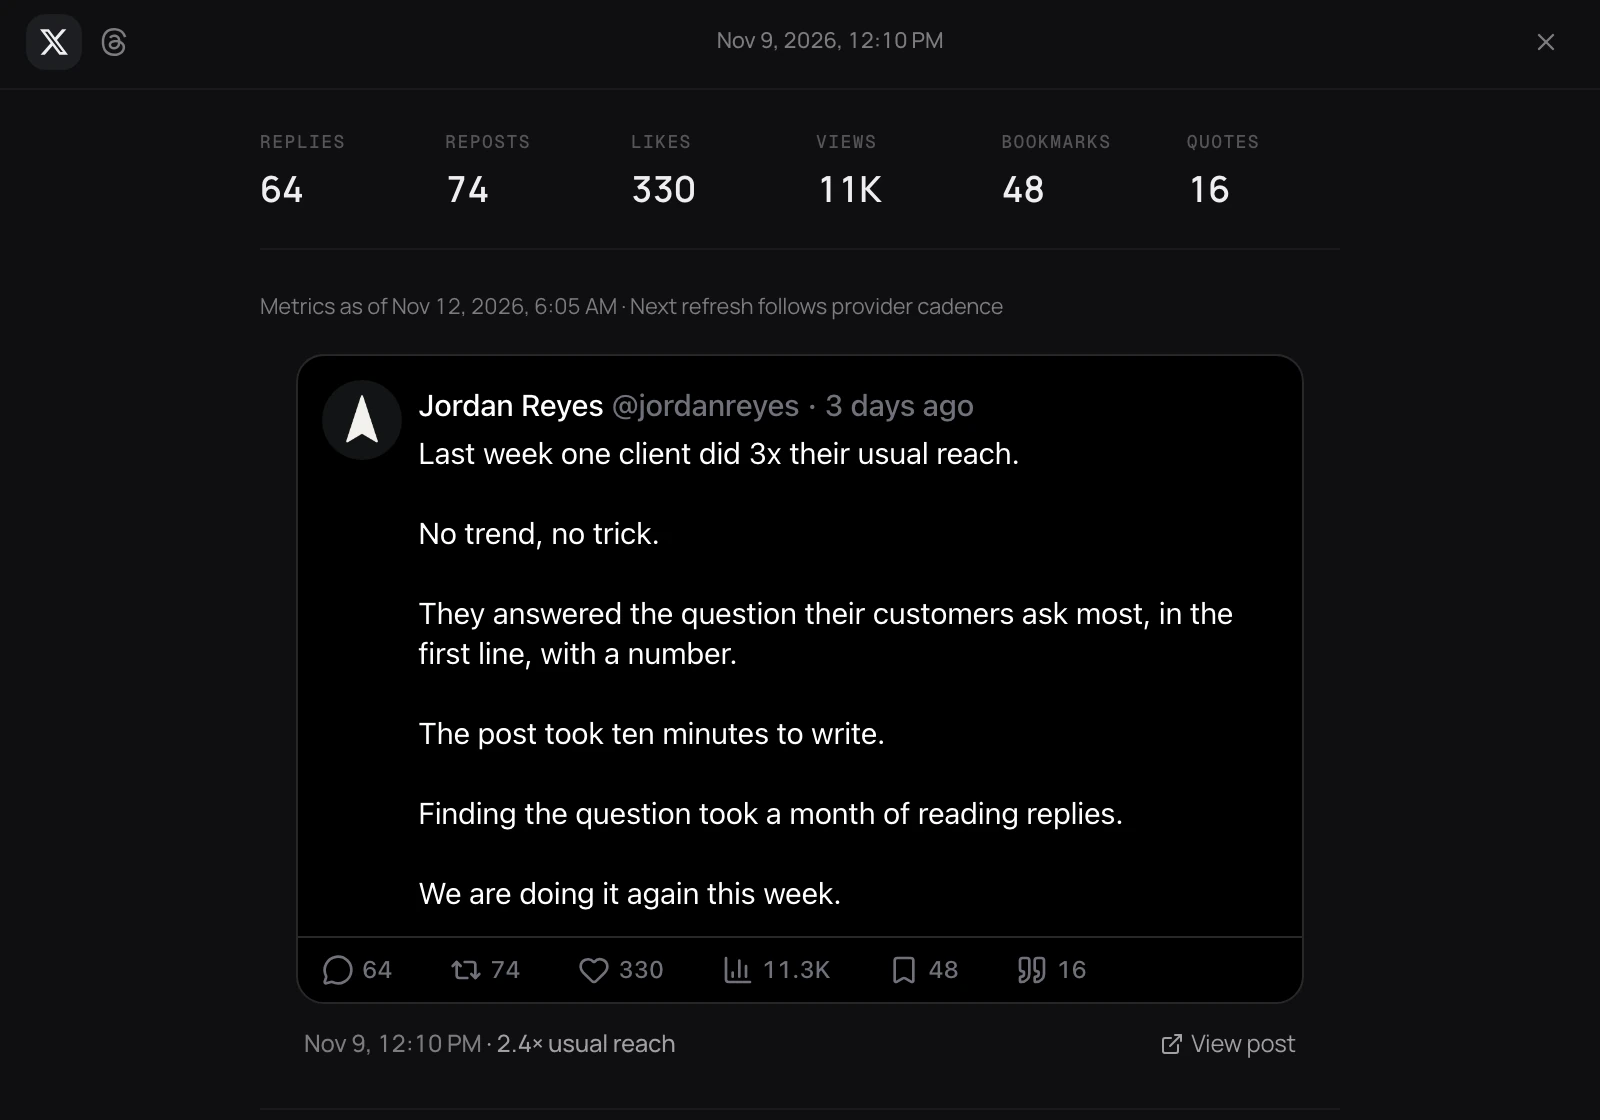
A published X post in Distinctful Analytics, dark mode, with its replies, reposts, likes, views, bookmarks, and quotes, marked 2.4 times the account’s usual reach

Narrow it to one account

Filter the list by platform or by a single account, and see how many posts each one published in the last 90 days.
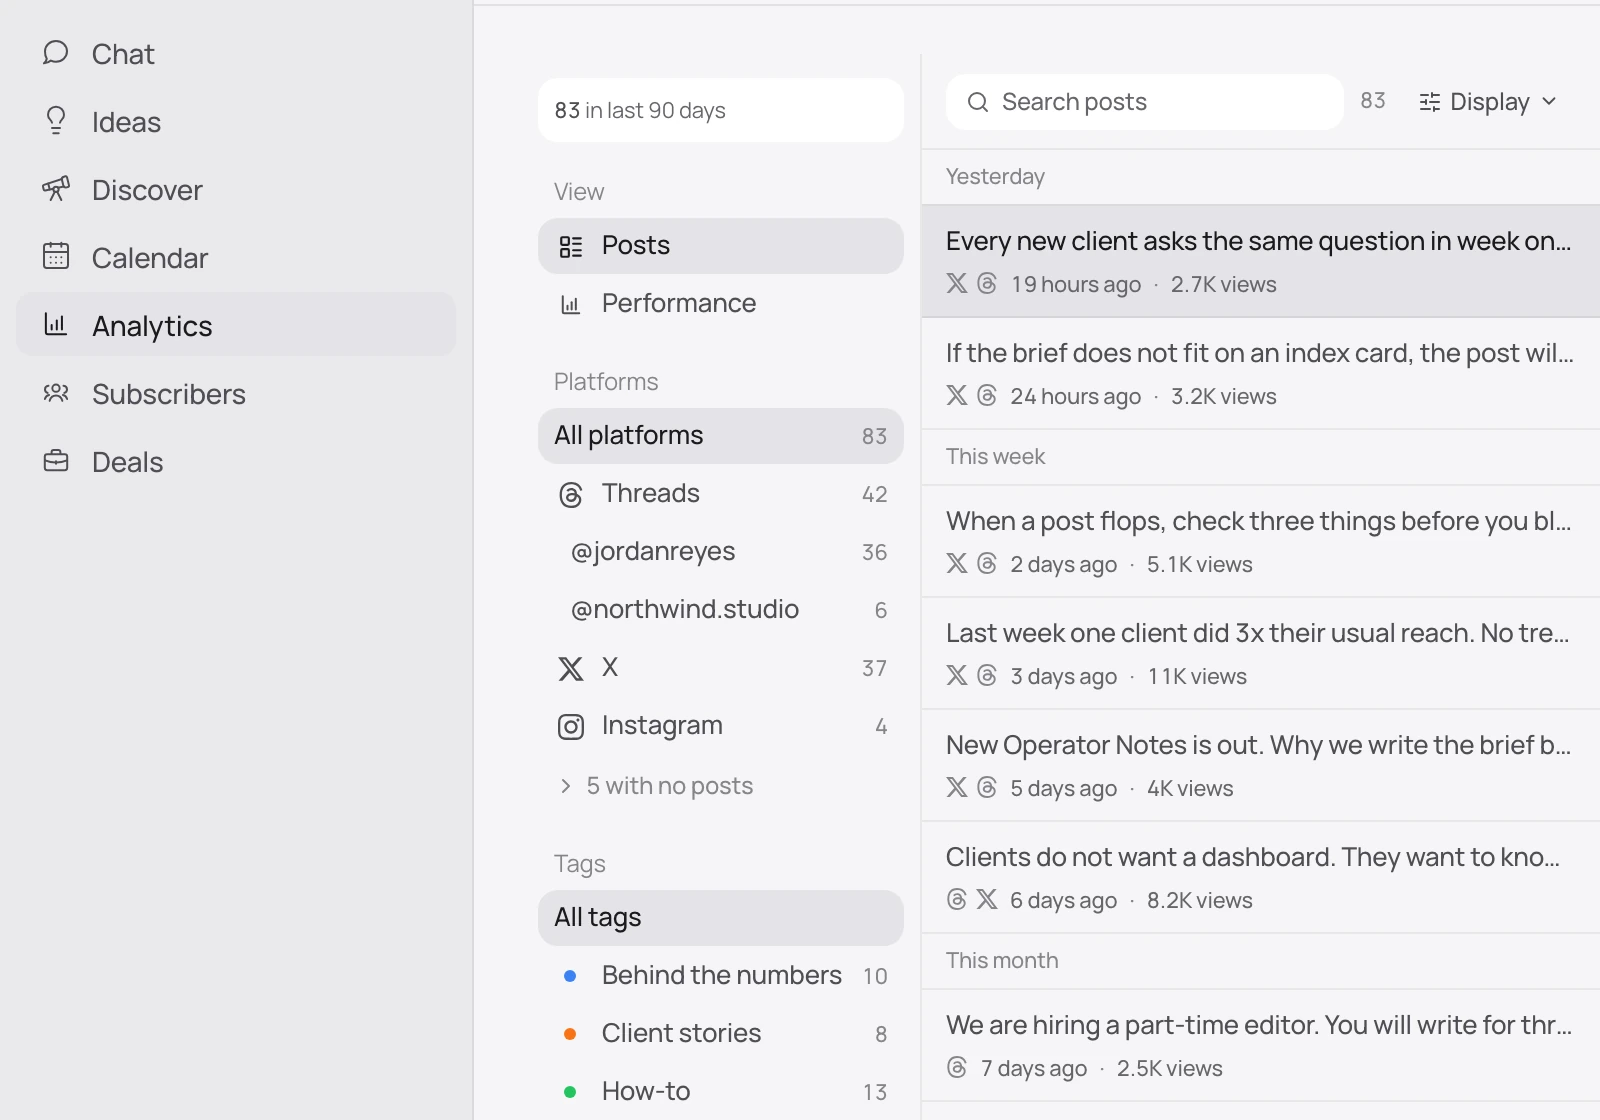
Distinctful Analytics filters in light mode: post counts for Threads, X, and Instagram and for each account, beside the list of posts

Compare kinds of posts

Tag posts by theme and see reach per post, engagement, and followers for each tag over the last 30 or 90 days.
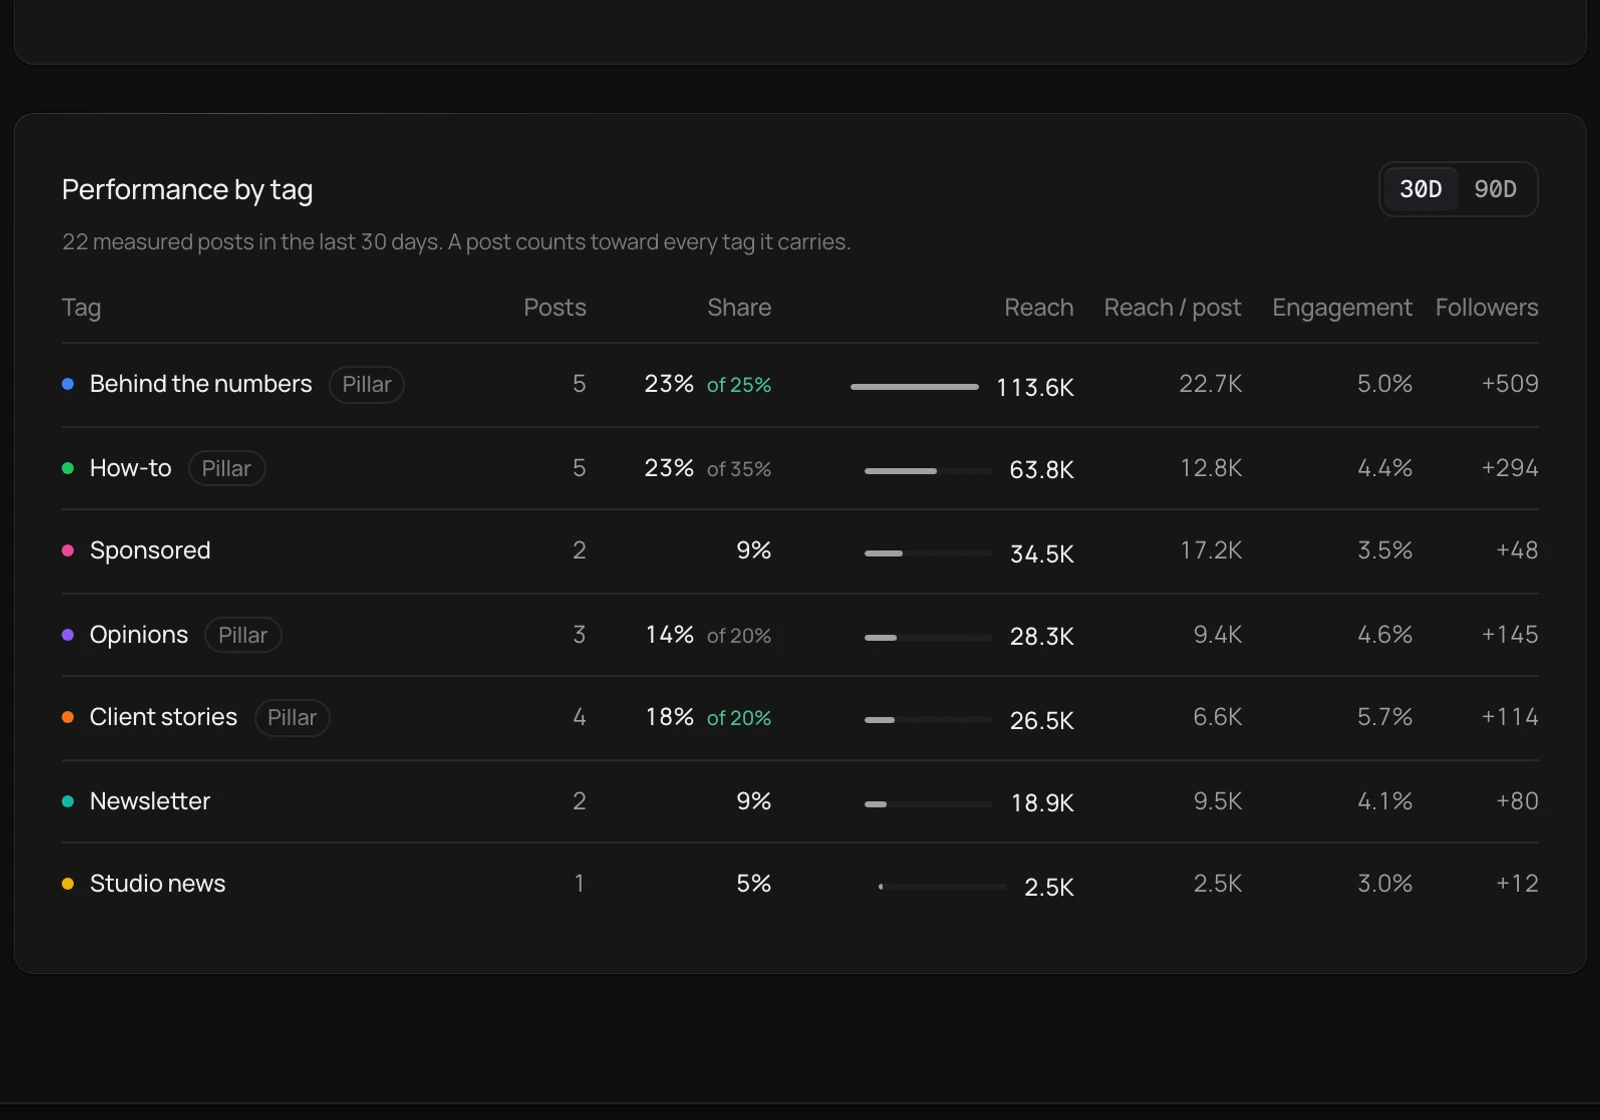
Performance by tag in Distinctful Analytics, dark mode: seven content themes compared by posts, share, reach, reach per post, engagement, and followers

Compare every account

One table sets your accounts side by side: reach, posts, reach per post, engagement, followers, and the best post from each.
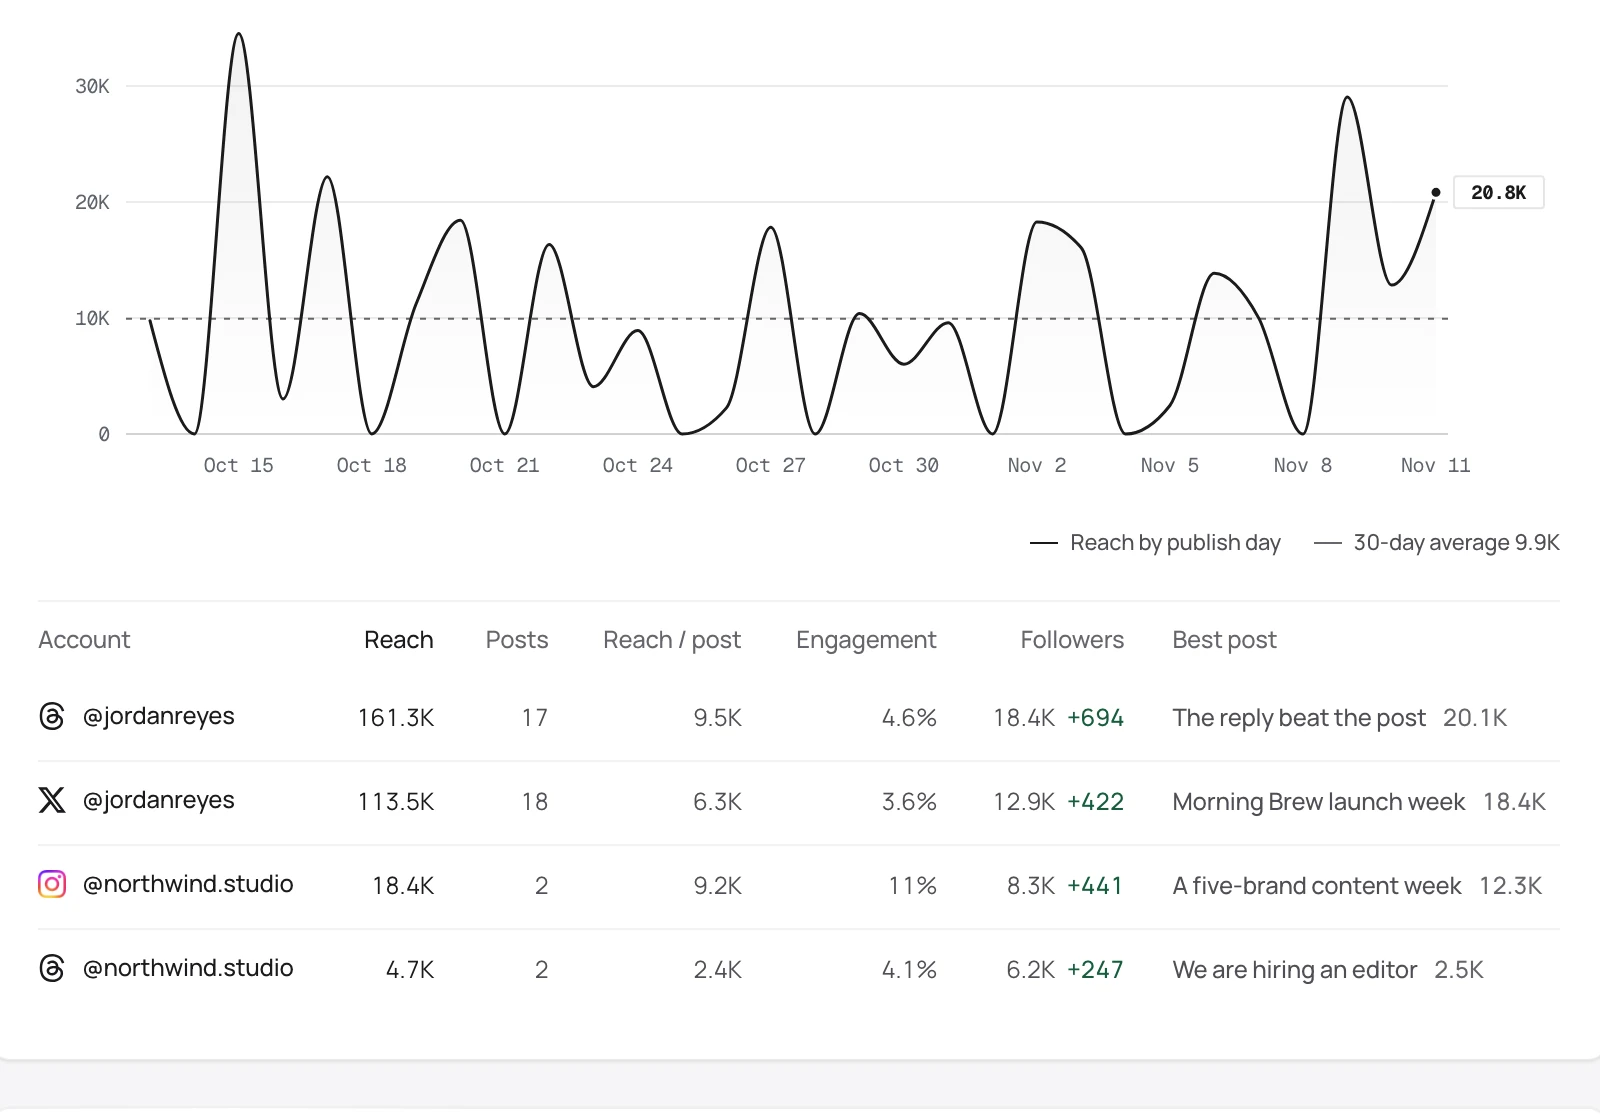
The account table in Distinctful Analytics, light mode: reach, posts, reach per post, engagement, followers, and best post for four accounts under a daily reach chart

One list for everything you published

Every published post sits in one list. Open one to see its preview and its numbers the way the platform reported them.
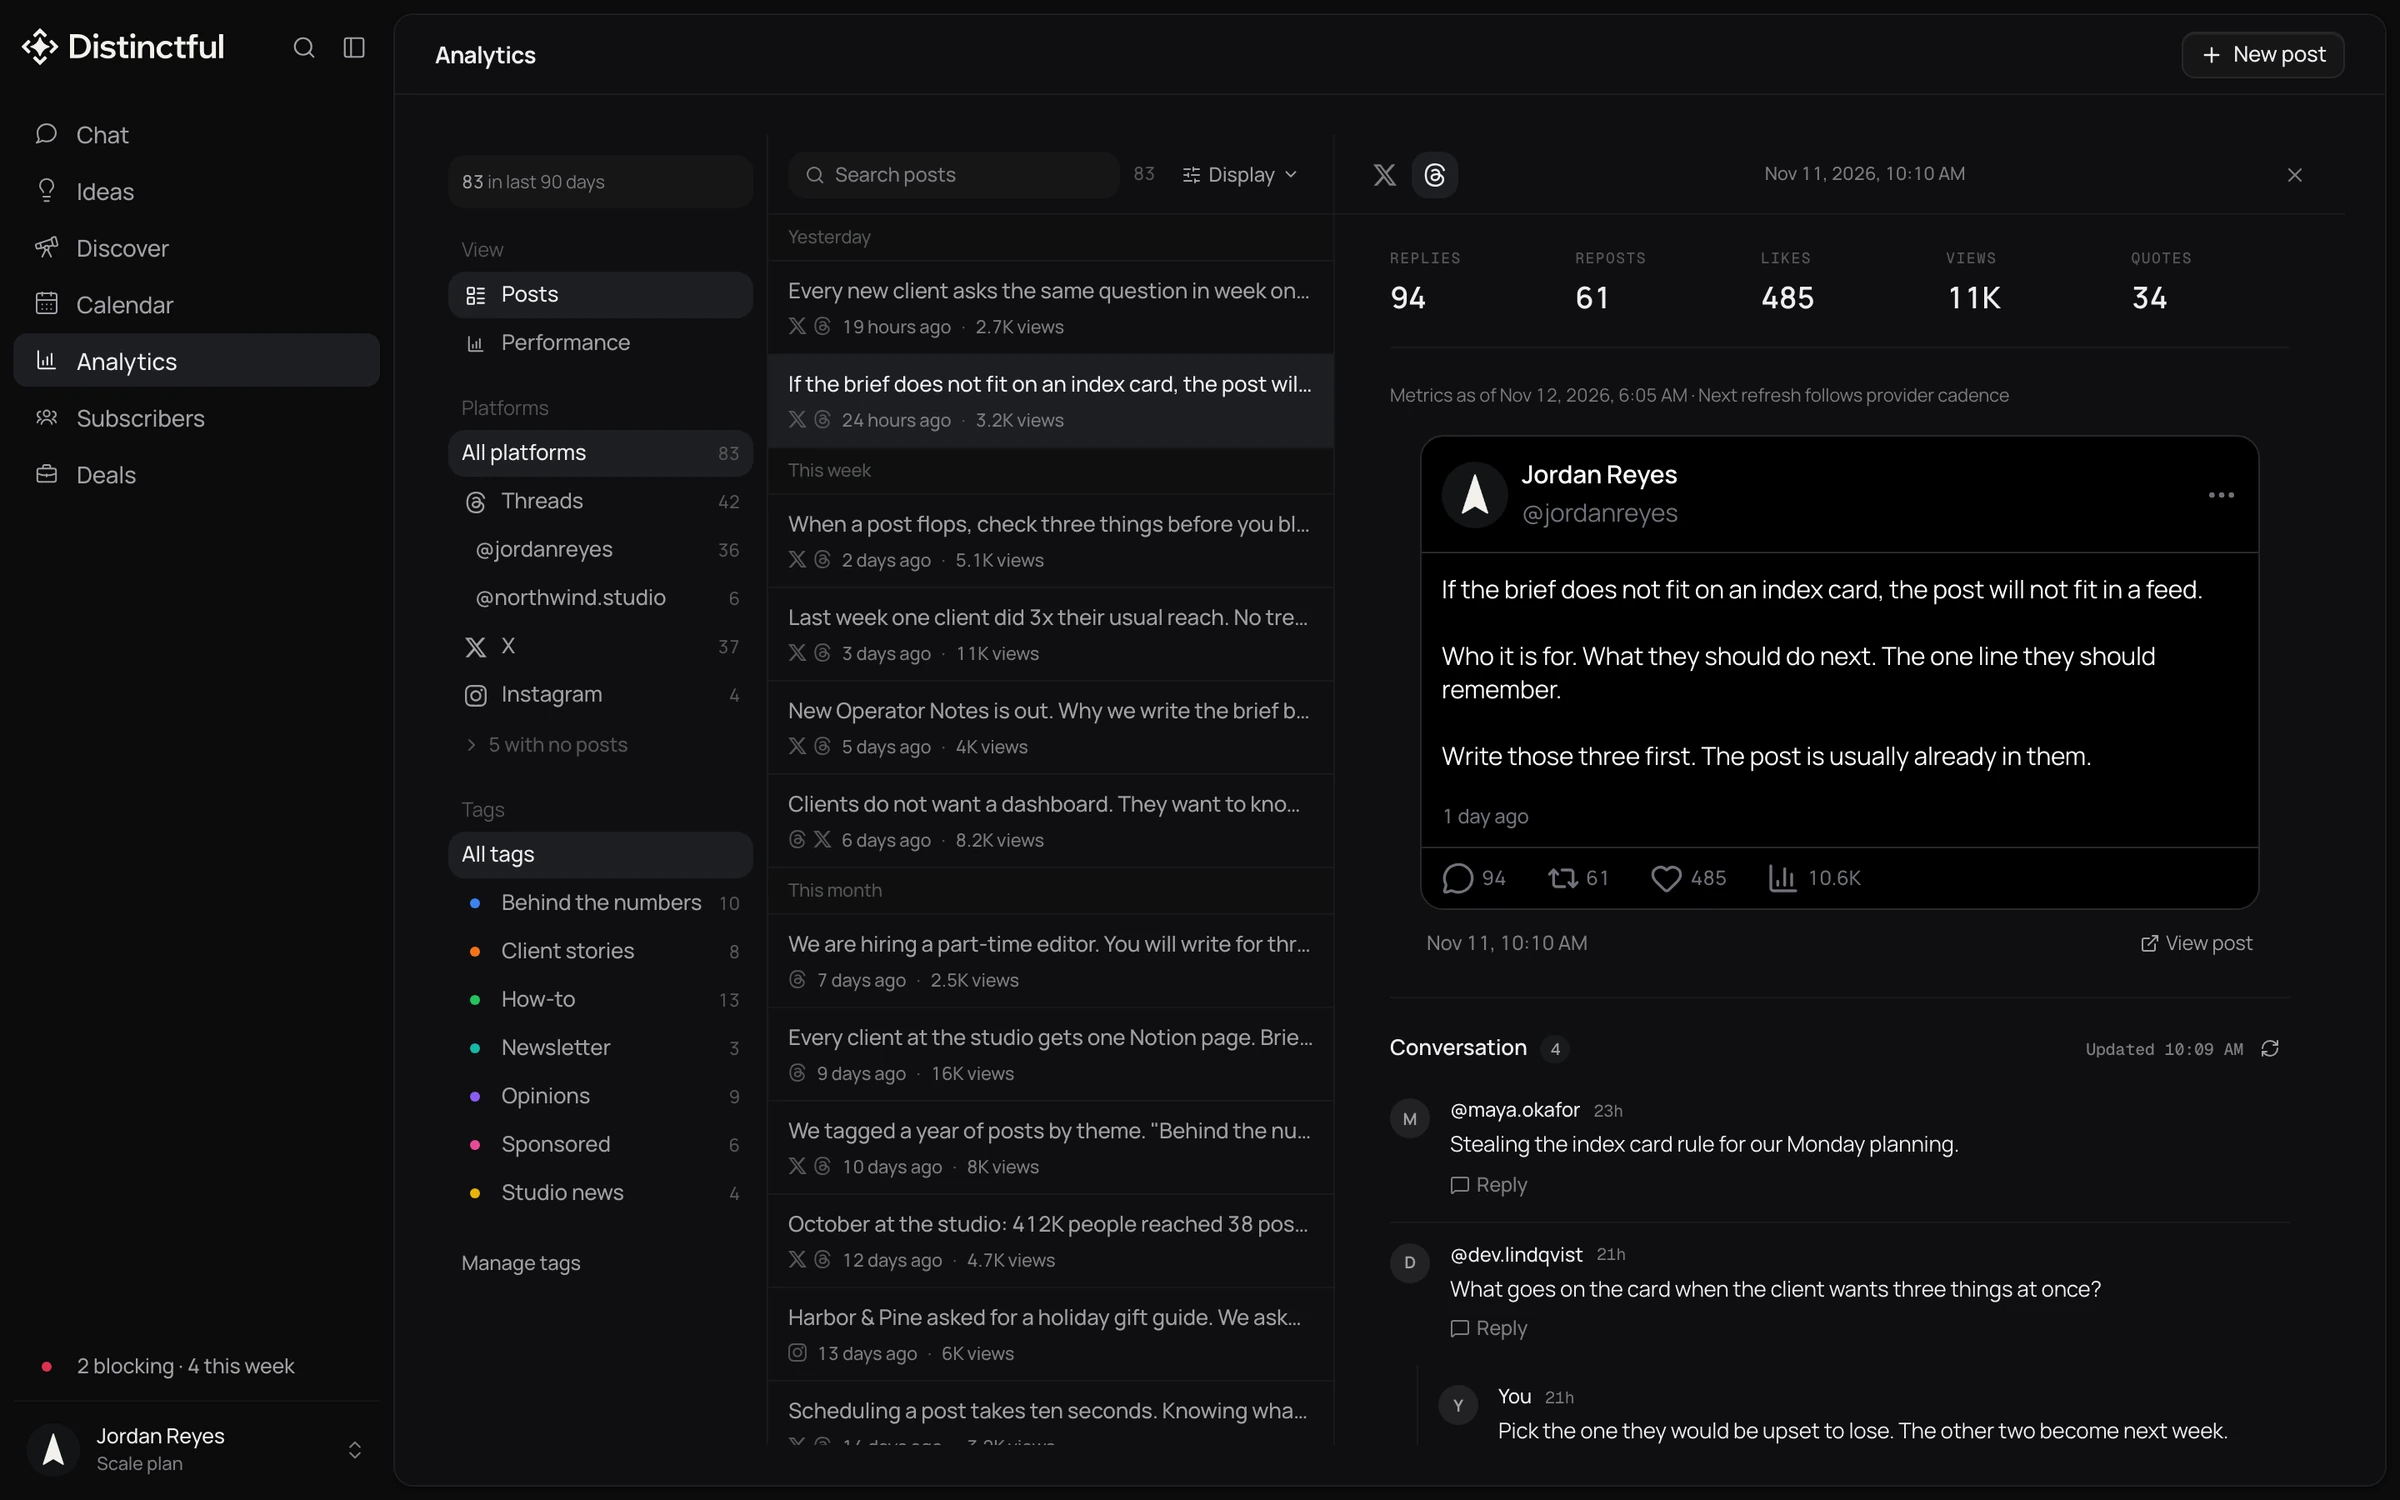
Distinctful Analytics in dark mode, Posts view: the list of published posts with one Threads post open, showing its numbers, its preview, and the replies under it

Run your organic marketing from ChatGPT and Claude

Schedule and post from the AI tools you already use. Connect Claude or ChatGPT and every post it plans lands on your calendar, built from your content strategy and pointed at your offers.

Pricing

Every plan starts with a 14-day free trial.

Grow

Most popular

For one person marketing a business

$39/month

Billed yearlySave $120

Choose Grow
  • Unlimited social posting
  • 12 social accounts
  • Discover 
  • Analytics 
  • Deals 
  • Encore automation 
  • 50,000 subscribers 
  • MCP
  • 125 credits / month 

Scale

For growing teams and agencies

$79/month

Billed yearlySave $240

Choose Scale

Everything in Grow, plus:

  • Unlimited teammates 
  • 25 social accounts
  • 3 workspaces, then $9 each 
  • Approvals and client reports 
  • API 
  • 150,000 subscribers 
  • 500 credits / month 
  • Priority support
Post to

Frequently asked
questions

How each post performed, using the metrics its platform reports, across every account you connect. Distinctful adds the comparison a single platform cannot: posts from different accounts in one list, grouped by the tags you give them.

Ready to get started?

Bring your accounts, your brand, and your best ideas. Try any plan free for 14 days.